Softwares
List of various projects which i have participated.
Coming soon, my homemade scripts that will be available on my github at https://github.com/cdjemiel
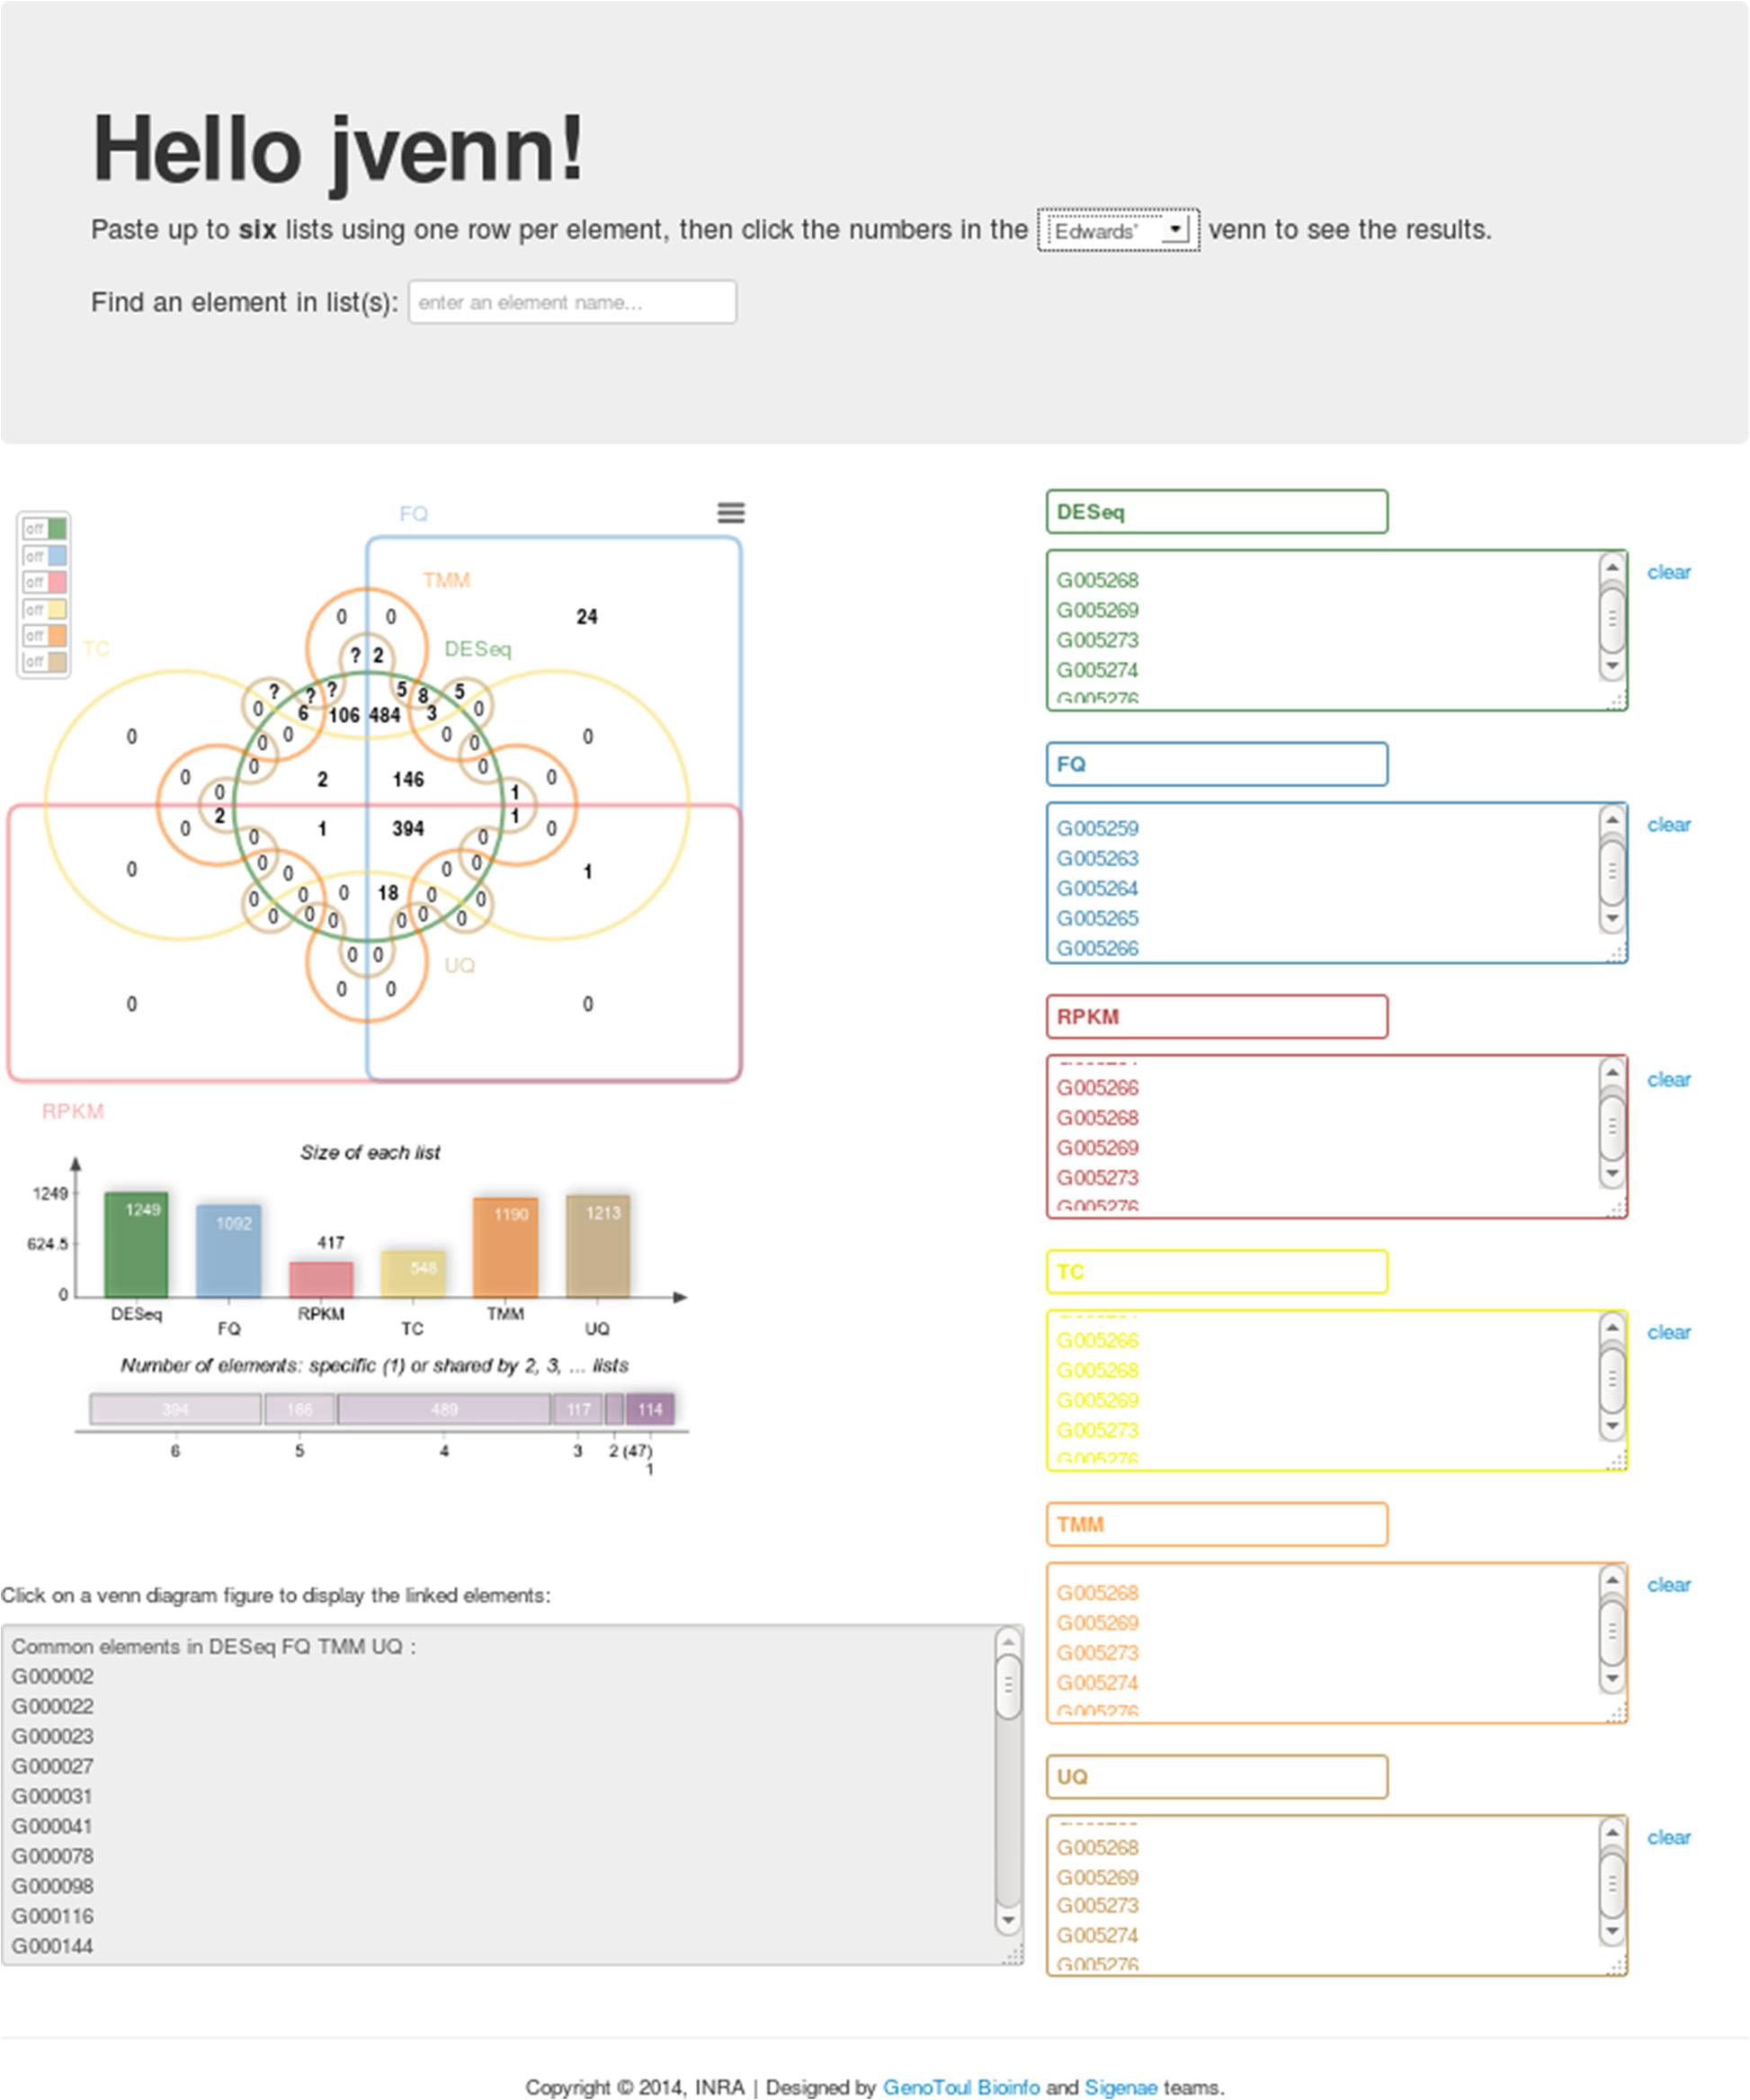
jvenn
BACKGROUND
Venn diagrams are commonly used to display list comparison. In biology, they are widely used to show the differences between gene lists originating from different differential analyses, for instance. They thus allow the comparison between different experimental conditions or between different methods. However, when the number of input lists exceeds four, the diagram becomes difficult to read. Alternative layouts and dynamic display features can improve its use and its readability.
RESULTS
jvenn is a new JavaScript library. It processes lists and produces Venn diagrams. It handles up to six input lists and presents results using classical or Edwards-Venn layouts. User interactions can be controlled and customized. Finally, jvenn can easily be embeded in a web page, allowing to have dynamic Venn diagrams.
CONCLUSIONS
jvenn is an open source component for web environments helping scientists to analyze their data. The library package, which comes with full documentation and an example, is freely available at http://bioinfo.genotoul.fr/jvenn.
@article{
title = {jvenn: an interactive Venn diagram viewer.},
type = {article},
year = {2014},
identifiers = {[object Object]},
keywords = {edward-venn,javascript,jquery,venn,vizualisation},
pages = {293},
volume = {15},
websites = {http://www.ncbi.nlm.nih.gov/pubmed/25176396},
month = {1},
id = {a13b57e6-bd1d-314d-b703-4bb59a4ec6bf},
created = {2014-10-07T10:02:37.000Z},
file_attached = {true},
profile_id = {5d5a4700-7a44-3df0-8715-150fe9bdba92},
last_modified = {2014-10-20T07:39:53.000Z},
read = {false},
starred = {false},
authored = {true},
confirmed = {true},
hidden = {false},
citation_key = {Bardou2014},
abstract = {BACKGROUND: Venn diagrams are commonly used to display list comparison. In biology, they are widely used to show the differences between gene lists originating from different differential analyses, for instance. They thus allow the comparison between different experimental conditions or between different methods. However, when the number of input lists exceeds four, the diagram becomes difficult to read. Alternative layouts and dynamic display features can improve its use and its readability.
RESULTS: jvenn is a new JavaScript library. It processes lists and produces Venn diagrams. It handles up to six input lists and presents results using classical or Edwards-Venn layouts. User interactions can be controlled and customized. Finally, jvenn can easily be embeded in a web page, allowing to have dynamic Venn diagrams.
CONCLUSIONS: jvenn is an open source component for web environments helping scientists to analyze their data. The library package, which comes with full documentation and an example, is freely available at http://bioinfo.genotoul.fr/jvenn.},
bibtype = {article},
author = {Bardou, Philippe and Mariette, Jérôme and Escudié, Frédéric and Djemiel, Christophe and Klopp, Christophe},
journal = {BMC bioinformatics}
}

ReClustOR
BACKGROUND
Environmental microbial communities are now widely studied using metabarcoding approaches, thanks to the democratization of high-throughput DNA sequencing technologies. The massive number of reads produced with these technologies requires bioinformatic solutions to be treated. A key step in the analysis is to cluster reads into Operational Taxonomic Units (or OTUs) and thus reduce the amount of data for downstream analyses. Due to the important impact of the clustering method on the quantity and quality of OTUs, finding an equilibrium between the reliability and time-consuming nature of the chosen strategy is a real challenge. The present article proposes a new post-clustering tool called ReClustOR aimed at improving the stability and reliability of OTUs whatever the initial clustering method.
RESULTS
We compared several clustering methods: a homemade de novo method, VSEARCH, Swarm and ReClustOR associated with these three clustering methods, and the ESV definition, using two datasets (a simulated one and an environmental one). All methods were analysed for their ability to efficiently describe microbial diversity in terms of alpha-diversity, beta-diversity and phylogeny. Dataset analysis showed that post-clustering with ReClustOR improved OTU detection not only in terms of diversity, but also in terms of reliability and stability as compared to the initial clustering methods. More precisely, the post-clustering step improved the congruence of the results (alpha-diversity, beta-diversity, composition) whatever the initial clustering method. Moreover, ReClustOR, by defining a database of centroids, precludes the need to re-cluster all the reads each time when new reads are generated.
CONCLUSIONS
ReClustOR is a new post-clustering method that overcomes problems (OTU stability and reliability) associated with classical clustering methods and thereby increases the quality and the congruence of the reconstructed OTUs. Moreover, the OTU database defined with ReClustOR can be used as a reference gradually enriched by merging new studies and samples. In this way, huge datasets (e.g. the Earth Microbiome Project or the Tara Oceans project) can be used as references for other projects within their range of application, and increase the quality of comparisons among studies and datasets.
@article{terrat2020reclustor, title={ReClustOR: a re-clustering tool using an open-reference method that improves operational taxonomic unit definition}, author={Terrat, S{\'e}bastien and Djemiel, Christophe and Journay, Corentin and Karimi, Battle and Dequiedt, Samuel and Horrigue, Walid and Maron, Pierre-Alain and Chemidlin Pr{\'e}vost-Bour{\'e}, Nicolas and Ranjard, Lionel}, journal={Methods in Ecology and Evolution}, volume={11}, number={1}, pages={168--180}, year={2020}, publisher={Wiley Online Library} }


